Taxing the Rich is Only a Start, Though it’s a Good One
It’s become near-consensus on the social democratic left that you can fund a decent welfare state by taxing the rich and shrinking the military. Sad to say that isn’t true. Those are good things in themselves, and you could pay for some excellent things with that agenda, but it would still be well short of actual social democracy.
I’m defining social democracy as a large and robust welfare state that socializes a lot of consumption through taxation and spending, compressing the income distribution, reducing poverty sharply, capping the political power of the rich, insulating people from the risks of sickness and unemployment, and educating people at low cost, all structured to reduce racial, gender, and other inequalities. It’s not the end of capitalism, but it’s a lot bigger than Medicare for All and free college, as badly as we need both those things tomorrow.
We’re sure not spending much on human uplift now. As the first graph below shows, the US spends less and taxes even less than other rich countries. In 2017 (the vintage of most of these stats), the US government at all levels (aka general government in fiscal jargon) took in 34% of GDP in taxes and spent 38%. Australia spent somewhat less and taxed somewhat more, but otherwise the US figures are the lowest of the bunch.
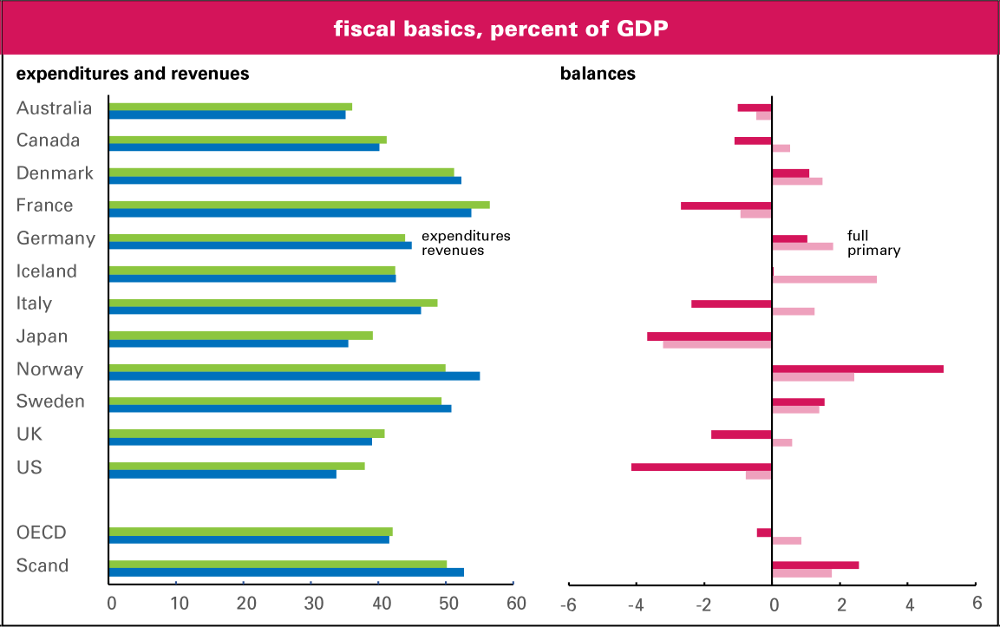
The three countries who are labeled “Scand” in these graphs – Denmark, Norway, and Sweden – spend an average of 50% of GDP and take in 53%. None is very far from those averages, which are 12 and 19 points above US levels respectively. The US lags the averages of the entire OECD (Organisation for Economic Co-operation and Development), the Paris-based think tank of, by, and for the richer countries (and the source of all these stats), by 4 points on spending and 8 points on revenue.
Some on the left suggest that we could also borrow more, but we’re already doing a lot of that, and to little good effect. Our budget deficit, over 4% of GDP, is the largest of any of the countries shown. It’s nine times the OECD average. The Scandinavians run a surplus, though Norway’s oil gusher distorts that average. Sweden and Denmark run surpluses over 1% of GDP. Australia and Canada run small deficits; Germany, a small surplus. If you listen to some of our more fervent populists and MMTers, to whom deficits are essential for economic health, you’d think these countries would be in a deep slump, but they’re not. And all have lower poverty rates and less inequality than the United States.
If you take out interest payments to get what’s known as the primary balance, the US had the largest deficit of any country but France. But you can’t take out interest payments – they can be big. They’re 3.4% of GDP for the US, three times the cost of Bernie Sanders’s free college scheme. That’s just a bit less than Italy, which has a far larger debt relative to its economy. (See top left graph of “spending shares,” a few paragraphs down.) Taking money from the mass of taxpayers and handing it over to mostly rich bondholders is a perverse use of state power.
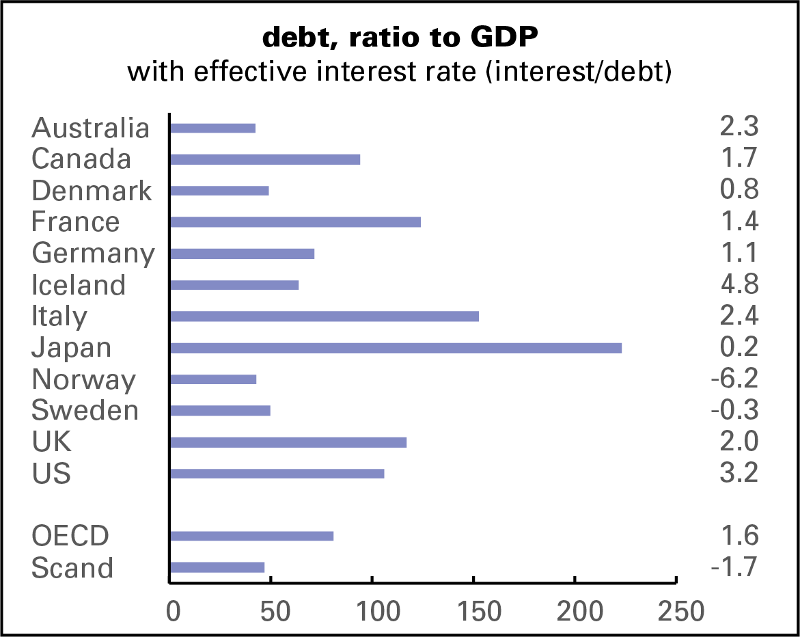
Deficits accumulate into debt over time. As the graph below shows, while the US debt burden is above the OECD average, it trails debt champs Italy and Japan. Australian and Scandinavian debt levels are low. Surprisingly, though, the effective interest rate (computed as the interest/GDP ratio divided by the debt/GDP ratio) paid by the US – the cornerstone of global capitalism whose government debt it the world’s benchmark – is twice the OECD average, and higher than Italy, a country not known for fiscal righteousness. But when you remember that junk bonds helped put Donald Trump where he is today, it begins to make sense. We’re not the sterling credit we used to be.
Spending
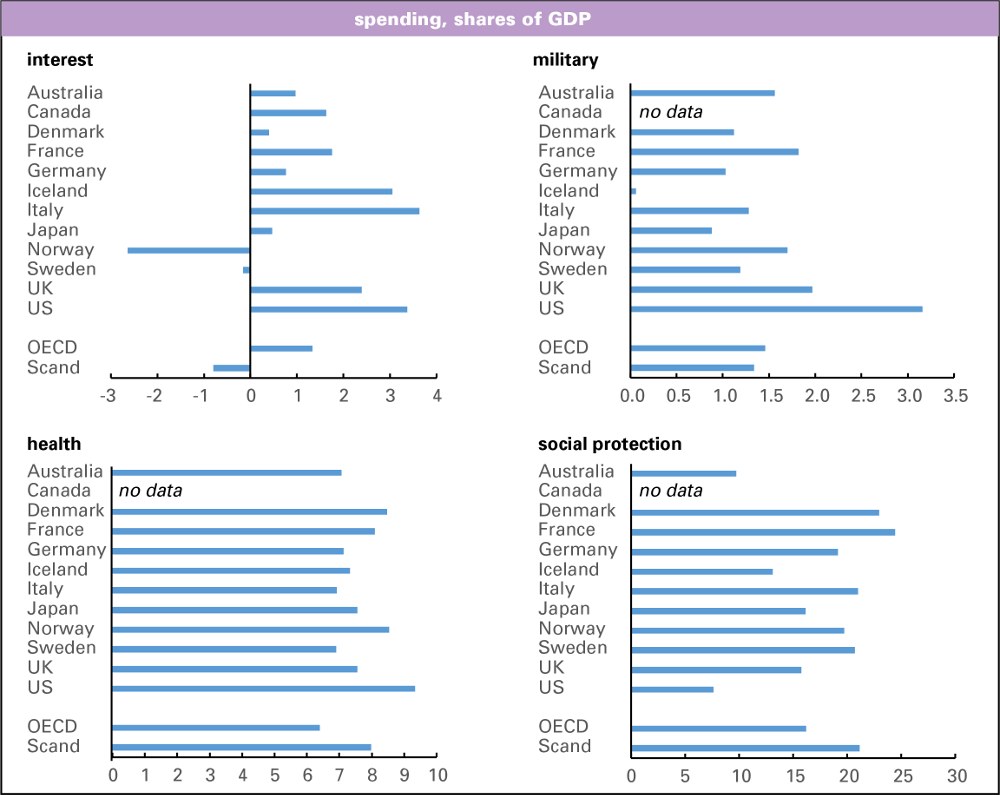
What do governments spend their money on? The graphs below give some idea. (For some inexplicable reason, much of the data for Canada is missing.) As already noted, the US spends a lot on interest paid to bondholders – well over twice the OECD average. The Scandinavian governments are net earners of interest, not payers, though that’s again largely because of Norway’s oil income and the vast investment portfolio it’s endowed.
The US spends well over twice the OECD average on the military, even more compared to the Scandinavians – 3.2% of GDP by the OECD’s accounting. According to the US national income accounts, the Pentagon eats up 3.9% of GDP, the difference from the OECD no doubt reflecting different classification schemes. (The OECD uses the internationally standardized System of National Accounts; the US marches to its own statistical drummer.) But that military spending number – which has hardly budged during the Trump years, his braggadocio to the contrary – is just over half what it was during the Reagan years and less than a third what it was at the peak of the Vietnam war. Still, it’s grotesquely high. Taking that near-4% down to the Japanese level of 1% would free up 3% of GDP for nobler pursuits. That’s significant but it’s not social democracy.
Not graphed here: spending on “public order,” cops, courts, prisons, and firefighting. Unsurprisingly, the US spends a lot on those, a fifth above average and 75% more than the Scandinavians, but the differences are less than 1% of GDP. There’s every reason to slash the regime of “public order” deeply, but it wouldn’t free massive amounts of resources – though of course it would free a lot of people and soften the depraved brutality of the American carceral state.
And cutting interest interest payments and radically shrinking the military and “criminal justice” system, which are minima for a better society, still wouldn’t change the public sector’s share of GDP, only redeploy it. Increasing that share would be essential to a serious social democratic program.
Surprisingly, the US spends a lot on health – more than any other country in the graph. More on all this in the near future, but it’s a reminder that public spending on health in the US is already enormous, and comes nowhere near covering everyone. Grafted on top of that public finance system – mainly Medicare and Medicaid – is an enormously wasteful private system that isn’t captured in these stats. That could be euthanized, its cash flows repurposed into a universal public system.
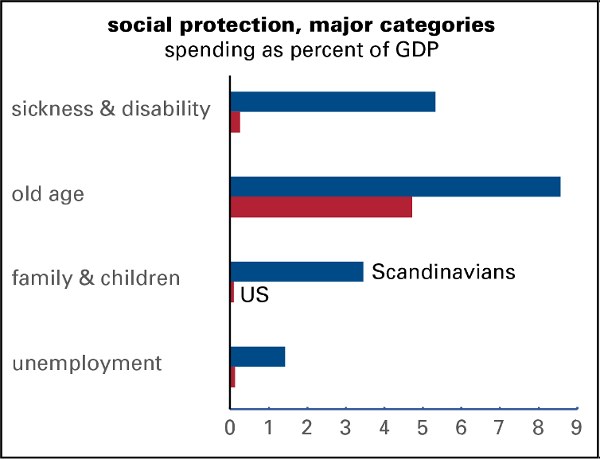
The fourth graph is where American exceptionalism really comes in – the share of GDP spent on “social protection,” that is, classic welfare state programs. In the OECD’s words, these include “sickness and disability; old age (i.e. pensions); survivors; family and children; unemployment; housing; social exclusion n.e.c. [not elsewhere classified]; [and] R&D social protection.” The US spends under 8% of GDP on these things, less than half the OECD average and a third what the Scandinavians spend. Over 60% of the US total goes to Social Security, compared to just over 40% for public pensions in Scandinavia. Despite that, pensions there are nearly twice as generous, measured as a share of GDP, than ours.
Unfortunately, the OECD breaks out social spending in detail for only a subset of member countries, all in Europe. But some rough comparisons are possible, using the US national income accounts. (See graph below.) Scandinavians spend over 12% of GDP on social protection other than pensions, more than four times the US’s 3%. They spend 5% on sickness and disability allowances; the US, little more than 0. They spend over 3% on family and children, things like child allowances and day care; we spend 0.1%, mostly on things like TANF. (The official description of TANF emphasizes not humane poverty reduction, but the promotion of marriage.) They spend 1.4% of GDP on the unemployed, both benefits and retraining schemes; we spend 0.1%. The US numbers are probably a little low, because the national income accounts table these are drawn from (table 3.12, here) may not include some indirect spending on these items, but not profoundly so. There are important things the US state just doesn’t do (publicly funded child care) or does only meanly (TANF).
There are other forms of spending that aren’t captured here. Public employment is 20% of the Swedish total and 15% in the US. Public investment is almost half again as high. Those differences mean government offices aren’t understaffed and dingy, and things in general don’t feel like they’re falling apart.
Taxing
How do the Scandinavian states – and others that are more generous social spenders than the US – finance that spending? Not, as we’ve seen, by borrowing. Countries with more generous welfare states than ours borrow far less. Instead, they tax.
Here are some of the principal revenue sources. On some things, like social security and personal and corporate income taxes, the US isn’t an outlier. On others we are. Property taxes, a core financing mechanism for US localities, take up 5% of GDP, over twice the OECD average and over three times the Scandinavian. At 5% of GDP, our taxes on goods and services – mostly value-added taxes (VATs) in other countries, not sales taxes, which are classed separately – are less than a third the Scandinavian share of GDP (16%), and not much larger compared to the OECD average (14%). The difference between the US and the Scandinavians is over 10% of GDP.
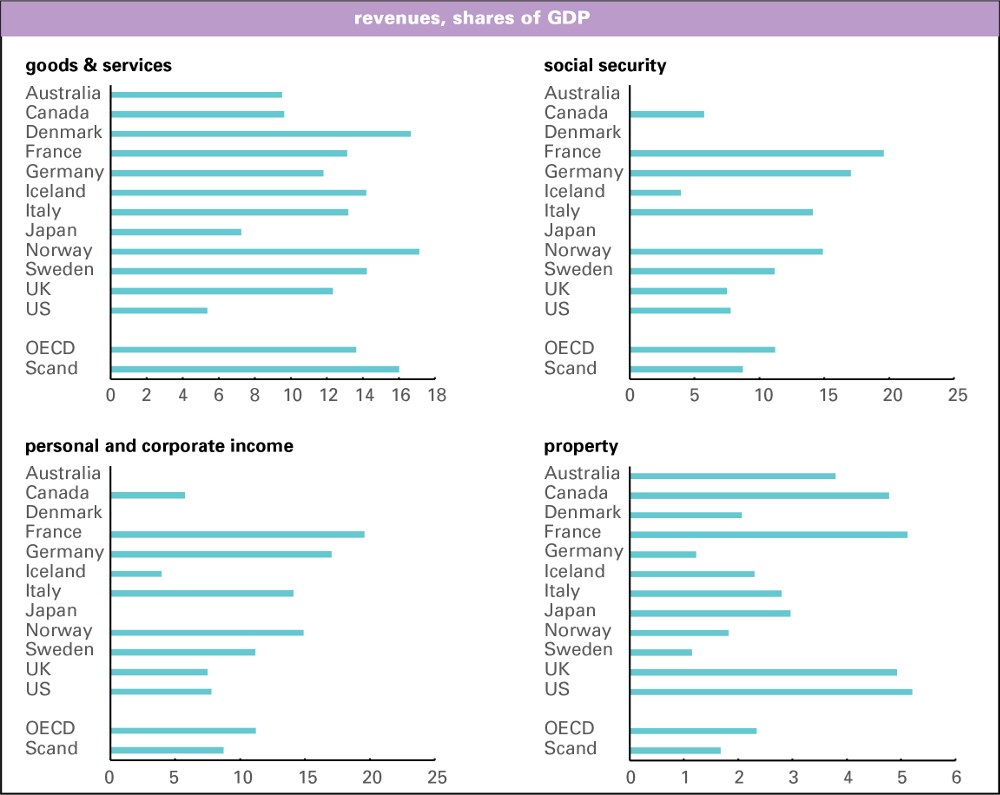
Yes VATs are regressive. They’re taxes on consumption that hit the poor harder than the rich because the further down the income scale you go, the larger a portion of your income you consume. But their regressivity is more than compensated for in the Scandinavian countries by spending, which not only takes from the rich and gives to the poor, but takes from the masses and gives it back in the form of good public services. It’s a way of socializing consumption to some degree, of taking things out of competitive markets. It makes for a less stressful life than the US, where the normal state is to be just a few paychecks from insolvency. Or worse.
The relationship between the share of the VAT take and spending on social production is impressively close; for the twelve countries shown, admittedly not a huge sample, the correlation coefficient between the two is 0.69. As Lawrence Summers once put it: “Republicans don’t like value-added taxes because they are a money machine and Democrats don’t like them because they are regressive. We will get a VAT when Democrats realize that it is a money machine and Republicans realize that it is regressive.”
Social Indicators
Here are a few statistical reminders of what all this social democracy can get you. Scandinavians live, on average, over three years longer than Americans – and Swedes, the longest-lived of the three, outlive Americans by almost four. (Danes have consistently lagged their neighbors, by about two years.) As the graph below shows, since at least 1960 (when the World Bank data begins), Scandinavian life expectancy has always exceeded American. The gap was just over three years six decades ago; that narrowed to just over a year in the mid-1980s, and then began widening – gradually at first, and accelerating after 2000 or so. US life expectancy fell between 2014 and 2017, which is almost unheard of among countries not at war or in social collapse; it fell again in 2018, though it’s not graphed here. Scandinavia’s has continued to rise.
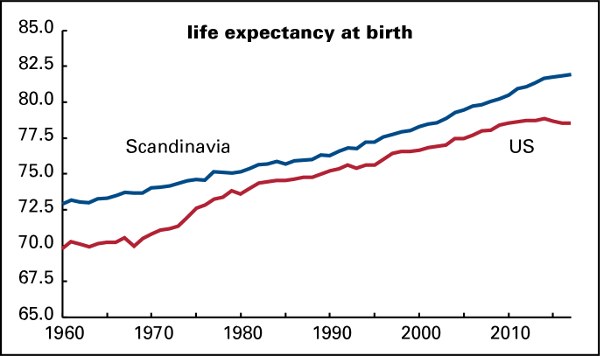 Part of that widening gap, and the recent US decline, can be explained by the insane expense and inaccessibility of the health care system, but it also reflects poverty, inequality, and the stresses that come with both.
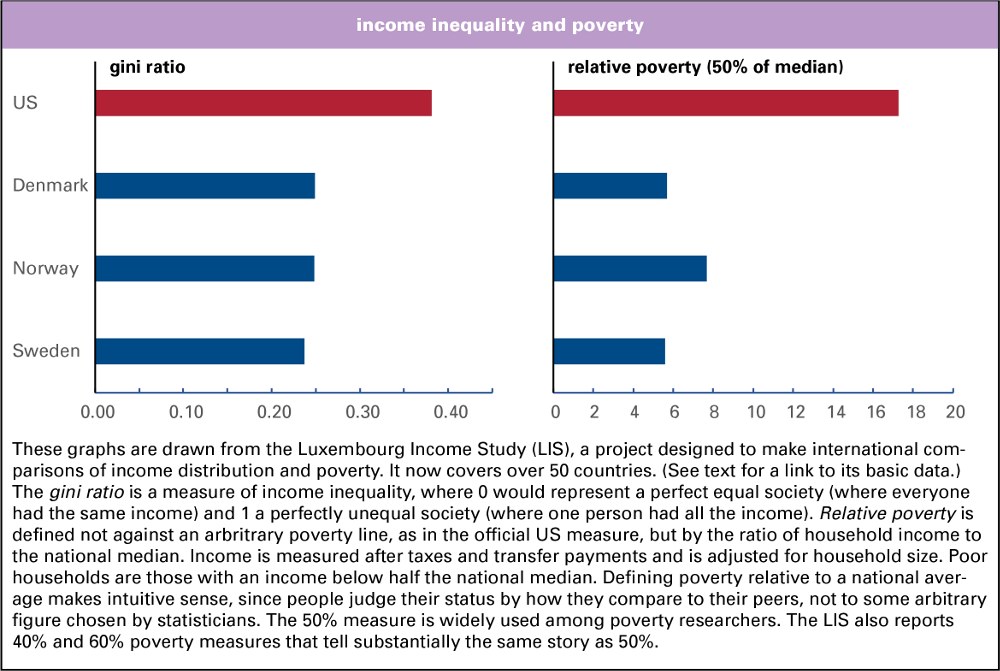
These are illustrated in the graph below. (See captions for definitions.) The US has the most unequal income distribution of any rich country for which the Luxembourg Income Study has data, though it still has a way to go to catch up to South Africa, Russia, and several Latin American countries. Much the same can be said for poverty; the US has the highest rate of any rich country other than Israel, though it’s also beaten by a similar set of poorer countries. Getting those numbers down would require some really ambitious social spending.
Can You Do It by Taxing the Rich?
Can you fund a Scandinavian-style welfare state by taxing the rich alone? No.
In 2012, the economists Peter Diamond and Emmanuel Saez published a widely cited paper arguing that the optimal top tax rate for soaking the rich is 73% – optimal in the sense of pulling in the most revenue. Any higher, and avoidance will undo any increase. Who knows? But let’s accept it for now. Working with those numbers, Washington Post wonk Jeff Stein figured that could pull in $320-billion a year at most. Stein also figures a 1% tax on the wealth of the top 1%, pretty much Elizabeth Warren’s plan, would pull in $200-billion a year. Bernie Sanders’s freshly released wealth tax plan would raise $435-billion a year, according to its designers, Saez and his Berkeley colleague Gabriel Zucman, who also designed Warren’s more modest levy. (A popular version of their analysis is here; a more technical one, here.)
Combine those two and you get a revenue increase of $520 – 755-billion, or 2.4 – 3.5% of GDP. Scandinavian revenues are 19 percentage points higher as a share of GDP than the US. (Recall that we not only need to spend more, we also need to borrow less if we’re to reduce the tribute paid to creditors.) So these taxes, which are probably what lots of contemporary American leftists have in mind, come only an eighth to a fifth of the way towards closing the gap with the Scandinavians (and it must be said the Scandinavian welfare states aren’t as generous as they were before neoliberalism set in, but they’re still big).
I’m taking these revenue estimates as they are. It seems likely that, were taxes raised sharply in this fashion, a good bit of the targeted money would disappear, and not just because of clever lawyers and accountants and the lure of offshore locations. CEOs, bankers, and star athletes wouldn’t be paid so highly if the money were going to be taxed away, as the experience of the 1950s and 1960s shows. Superstar incomes have flourished because they’ve been so lightly taxed. Stocks, where the very rich earn a lot of their money – a large share of the income of the very rich is from capital gains – would not be so richly valued under a government so clearly hostile to wealth. The ranks and riches of tech bros and hedgies would be radically shrunk.
A few stats about the Forbes 400 will underscore these points. When the magazine first issued it annual list of the USA’s richest in 1982, No. 400 was “worth” $75-million (which would equal $195-million in 2018 dollars), and the whole lot of them together tipped the scales at $94-billion, or not quite 3% of GDP. Last year, the minimum price of admission was $2.1-billion – eleven times the current value of 1982’s minimum – and the whole gang claimed $2.9-trillion, or 14% of GDP. It’s no accident, as the vulgar Marxists used to say, that the list made its debut in September 1982, one month after the great bull market in stocks began – one that, aside from a few stumbles, like the 1987 crash and the 2008 financial crisis, continues to this day. It’s been a riot of accumulation.
A major reason why so much money as accumulated at the top is that policy has been coddling the rich for decades, with assistance from a popular culture that has celebrated them. We want to throw all that into reverse. To reduce the power of the rich requires taking their money away – as Sanders said in introducing the wealth tax, “I don’t think that billionaires should exist.” Stocks and other financial assets would deflate profoundly.
That means you can’t plan for those hoards of money to be a constant source of recurring revenue, a point that Saez and Zucman do not address in those two papers, but which they do address in their forthcoming book, The Triumph of Injustice. As they say – in a short passage quite deep into it – “In the long run, a radical wealth tax erodes top fortunes so much that it reduces the taxes paid by the ultra-rich…” Although that’s a comment about the wealth tax, it could be adapted to high rates on top incomes. The point is less revenue-raising, though you can do some of that, but giving extreme wealth a very radical haircut. Plutocrats will whine about “confiscatory taxation,” and they will be right. And with a reduction in their riches would come a reduction in their political power. Right now that seems like a pleasant dream, but we should be clear on the politics involved.
Which takes us back to the need for broader taxation to fund a civilized welfare state. In the book, Saez and Zucman reject a VAT for the US as too regressive, and propose a tax on all forms of income. The numbers they float are well short of a full welfare state – it’s little more than Medicare for All and free college (both of which, let me say again, we need badly). But regardless of the style of tax and its level, we’d have to raise more revenue, and not just from the rich.
Some might find it impolitic of me to say all this, but you have to be honest with people, otherwise they’ll turn on you for selling a bill of goods. There’s no doubt that adding 3% of GDP to social spending would be a good start – it would improve people’s lives and change their expectations. Elites hate giving the masses anything, lest it increase the appetite for more – and, as Sam Gindin argues, the lowering of expectations has been one of neoliberalism’s great successes.
We could frame the programs financed by taxing the rich as an overture or downpayment and hope that stimulates the appetite for more. But if we want a seriously better society of the sort outlined in the Green New Deal, then it’s going to take a lot more – and it won’t “pay for itself.” As Ralph Waldo Emerson said, “nothing is got for nothing.” •
This article first published on the LBO News website.