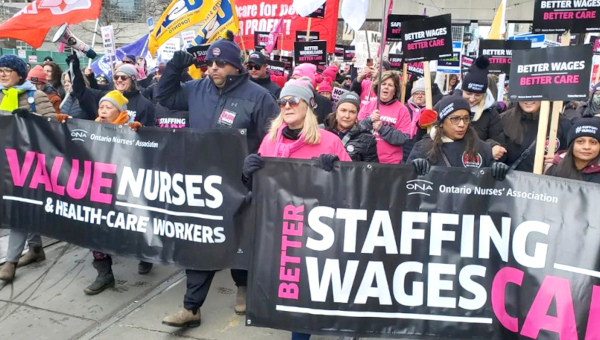
Violence, Gender and Healthcare Provisioning in Ontario
Contrary to popular perception, there are more assaults in hospitals than in any other industry. Long-term care facilities are also major sites for assaults. Healthcare as a whole has by far the most assaults that result in lost time injuries – far, far more than any other sector. Assaults in hospitals and LTC are overwhelmingly on women, and they are increasing over time.
Healthcare support jobs have seen almost half of all the assaults on healthcare staff. Healthcare support jobs are now the occupation with the most assaults resulting in lost time injuries – far more than police and firefighters combined.
Workplace Safety and Insurance Board (WSIB) data on approved lost time claims for violent assaults shows that hospital employees have more approved lost time injury claims for assaults than any other industry. With 2,459 over 2011-2019 that is 10% of the total lost time injuries for assaults and 44% more than the next highest industry group. As many hospitals are “Schedule 2” employees and reported under that category, this significantly under-reports the number of such assaults in hospitals.
Assault and Injury Numbers
These assaults constitute 12% of approved hospital lost time injuries over 2011-2019:
| Injury Event | 853 Hospitals | % |
|---|---|---|
| Assaults, violent acts, harassment | 2459 | 12% |
| Bodily reaction and exertion | 9422 | 46% |
| Contact with objects | 2488 | 12% |
| Exposure to harmful substances | 2835 | 14% |
| Falls | 2930 | 14% |
| Fires and explosions | 8 | 0 |
| Other events/exposure unknown | 99 | 0 |
| Transportation accidents | 119 | 1% |
| Total | 20,360 | 100% |
| Industry Sector | Assaults, violent acts, harassment |
|---|---|
| Healthcare | 7222 |
| Services | 1484 |
| Manufacturing | 983 |
| Agriculture | 440 |
| Transportation | 288 |
| Municipal | 272 |
| Education | 187 |
| Construction | 125 |
| Food | 39 |
| Automotive | 30 |
| Electrical | 28 |
| Chemicals/Process | 14 |
| Primary Metals | 9 |
Homes for nursing care have the third most approved lost time claims for assaults, with 1,398. Accordingly, when reported by industrial sector, healthcare has by far the most approved lost time injuries for assaults (see table to right).
Although there is limited data available for 2020, we can say that 31.5% of all approved claims for assault were found in healthcare occupations: 932 out of 2,963.
The trend over time has been for such assaults to increase in hospitals:
| Injury Event | Rate Group | 2011 | 2012 | 2013 | 2014 | 2015 | 2016 | 2017 | 2018 | 2019 |
|---|---|---|---|---|---|---|---|---|---|---|
| Assaults, violent acts, harassment | 853 Hospitals | 221 | 193 | 223 | 238 | 280 | 280 | 271 | 368 | 385 |
So, the 753 approved claims in 2018 and 2019 are 82% more than the 414 in 2011 and 2012.
The same upward trend over time is seen in homes for nursing care:
| Injury Event | Rate Group | 2011 | 2012 | 2013 | 2014 | 2015 | 2016 | 2017 | 2018 | 2019 |
|---|---|---|---|---|---|---|---|---|---|---|
| Assaults, violent acts, harassment | 851 Homes for Nursing Care |
131 | 131 | 130 | 161 | 152 | 136 | 139 | 189 | 229 |
This trend upwards is also seen when looking at the healthcare industry as a whole:
| Injury Event | Industry | 2011 | 2012 | 2013 | 2014 | 2015 | 2016 | 2017 | 2018 | 2019 |
|---|---|---|---|---|---|---|---|---|---|---|
| Assaults, violent acts, harassment | Healthcare | 650 | 615 | 636 | 676 | 747 | 808 | 846 | 1042 | 1202 |
There has been a significant increase in assaults on “Assisting Occupations in Support of Health Services” over time:
| Injury Event | Occupation | 2011 | 2012 | 2013 | 2014 | 2015 | 2016 | 2017 | 2018 | 2019 |
|---|---|---|---|---|---|---|---|---|---|---|
| Assaults, violent acts, harassment | Assisting Occ. | 223 | 213 | 228 | 257 | 270 | 289 | 392 | 515 | 602 |
There were 1,117 assaults resulting in approved lost time claims on these healthcare support occupations in 2019 and 2020 compared with 436 in 2011 and 2012. That is a 156% increase.
Notably other occupations that experience a significant number of assaults have not seen a similar trend upwards:
| Injury Event | Occupation | 2011 | 2012 | 2013 | 2014 | 2015 | 2016 | 2017 | 2018 | 2019 |
|---|---|---|---|---|---|---|---|---|---|---|
| Assaults, violent acts, harassment | Police, Firefighters | 304 | 283 | 279 | 259 | 249 | 280 | 271 | 333 | 343 |
So assaults need not increase. They just are increasing in healthcare.
Assaults overwhelmingly are on women in healthcare. Here is the pattern over 2011-2019:
| Injury Event | Gender | Healthcare |
|---|---|---|
| Assaults, violent acts, harassment | Female | 6029 |
| Assaults, violent acts, harassment | Male | 1193 |
Fully 83.5% of healthcare lost time assaults are on women. This pattern is also true in hospitals and homes for nursing care:
| Rate Group | Gender | Assaults, violent acts, harassment |
|---|---|---|
| 853 Hospitals | Female | 1871 |
| 853 Hospitals | Male | 588 |
| 851 Home for Nursing | Female | 1329 |
| 851 Home for Nursing | Male | 69 |
“Assisting Occupations in Support of Health Services” have experienced a significant amount of violence. Of the 7,222 approved lost time claims for assaults in the health sector between 2011 and 2019, 3,461 were on people working in “Assisting Occupations in Support of Health Services.” That is 48% of the total healthcare assaults resulting in lost time injuries:
| Injury Event | Assisting Occ. |
|---|---|
| Assaults, violent acts, harassment | 3461 |
Of all healthcare occupations clearly identified by WSIB, “Assisting Occupations in Support of Health Services” has experienced by far the most assaults resulting in approved lost time claims:
| Occupation | Assaults, violent acts, harassment |
|---|---|
| Assisting Occupations | 3461 |
| Nurse Supervisors | 1697 |
| Other tech. | 1260 |
| Managers | 291 |
| Medical Tech. | 88 |
| Physicians | 28 |
| Pharmacists | 24 |
| Optometrists, chiro, and other | 9 |
It is notable that those in healthcare supportive occupations, at the lowest end of the healthcare hierarchy, experience the most assaults. Assaults on managers and physicians are comparatively rare.
Finally, the low profile of violence against healthcare staff and the fact that these attacks are overwhelming on women can hardly be assumed to be coincidental. •
This article first published on the OCHU Left Words website.