Women’s Wages and the Attack on Public Sector Workers
Since the Ford government came to power in 2018 in Ontario, there has been an attack on the wages of workers in the broader public sector. This is also an attack on women’s wages. The result is that women’s wages have been eroded in the leading sector of women’s work. This has led to both an erosion in real wages and an erosion in wages in these female-dominated sectors relative to other industrial sectors.
Women comprise 74% of the Ontario education, healthcare, and social assistance workforce. A strong female majority is present in all these sectors but is especially marked in healthcare and social assistance, where 762,800 women work – 80% of the healthcare and social assistance workforce. These industries employ 1.2 million female workers and account for 32% of all women employees in Ontario. They are the largest industries for women workers.1 So, what happens to these workers has a significant impact on women.
For men, it is a different story – education, health, and social assistance account for only 9.0% of all male employment in Ontario. So, overall, males, as a group, are much less affected by what happens in these sectors.
Broader Public Sector (BPS)
| Geography: | Ontario | ||
|---|---|---|---|
| Labour force characteristics: | Employment | ||
| Sex: | Both Sexes | Males | Females |
| Age group: | 15+ | 15+ | 15+ |
| Classification: | December 2023 | December 2023 | December 2023 |
| Persons | |||
| Total, all industries | 7906.8 | 4135.3 | 3711.5 |
| Retail trade | 844.3 | 425.9 | 428.4 |
| Educational services | 605.4 | 180.9 | 424.5 |
| Healthcare and social assistance | 964.8 | 193.0 | 711.8 |
| Statistics Canada. Table 14-10-0022-01 Labour force characteristics by industry, monthly, unadjusted for seasonality (x 1,000). | |||
These industries are the great bulk of the provincial broader public sector or “BPS.” The BPS is the portion of the public sector that is primarily funded by the provincial government. It comprises 18.5% of the Ontario workforce.2 The impact of the BPS on women’s wages is significant. So, what has happened to BPS wages?
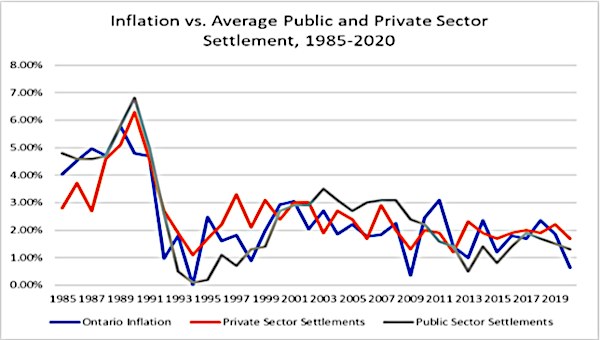
Public Sector Wage Settlements: Over the last 40 years, BPS settlements have sometimes lagged behind inflation or private sector settlements and they have sometimes exceeded inflation or private sector settlements. The periods when they have lagged have been associated with government legislative attempts to suppress their wages. These attacks have been followed by periods when BPS wage settlements exceeded inflation and private sector settlements.
We have now, however, been in an unusually long period of depressed BPS settlements, coinciding with two separate attempts to lower BPS settlements through legislation. Those attempts are now over, and the government has repealed the latest legislation suppressing BPS wages (Bill 124). There were signs, beginning in late 2023, that BPS settlements were beginning to make up their lost ground as they have done in the past. That trend towards improved settlements will be opposed by the current government, no doubt, but it is consistent with Ontario history.
Following legislative attacks on wage settlements in the early 1980s, public sector settlements were somewhat higher than inflation and private sector settlements in the latter half of the 1980s. In the 1990s, public sector wage settlements were again pushed lower by government legislative initiatives, sharp funding cuts, and concerted government policy. In the first decade of the 21st century, public sector settlements were, once more, somewhat higher than private sector settlements and inflation.
The pattern here is that public sector wage losses to inflation or private sector settlements due to government legislation and policy were eventually made up by periods during which BPS settlements were higher.
Starting in the second decade of the twentieth century, another push to lower BPS wages was made. This time, however, fourteen years later, we are only beginning to see the losses made up – and perhaps only for a moment.
The struggle over BPS wage settlement since 2010: In 2010, the provincial government began imposing austerity on BPS wages. In that year, the Ontario government required BPS unions to negotiate over a proposed wage freeze. Few unions took them up on their offer – but that was the start of more than a decade of wage austerity directed at BPS workers. This proved to be a serious and lasting initiative, with women workers being the major victim.
The scheme really took off after the introduction of Bill 115, which would freeze BPS wages. Unions and others fought off the Bill in a 2012 showdown. While the right to free collective bargaining was retained for BPS workers and the Bill was ultimately withdrawn, the result for hundreds of thousands of BPS workers was very low wage settlements, falling well behind private sector settlements and inflation.
There was a temporary and modest reprieve for BPS settlements in 2017, just before the provincial election.
After the current government came to power in 2018, however, wages fell even further behind. The new government passed Bill 124, and this legislation imposed lower wage settlements on the BPS once again.
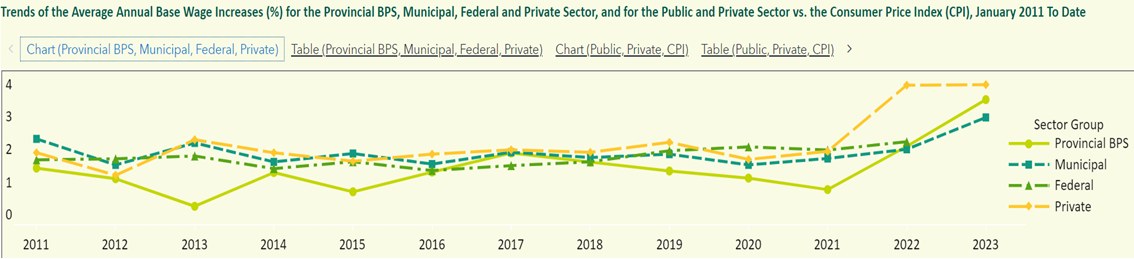
The chart above shows that BPS settlements have lagged behind other settlements over the post-2010 period up until the pattern began to change at the very end of 2022 when school board workers, enraged by shrinking wages, struck and pushed the BPS average way up – a pattern that has been built upon, with new, even higher BPS settlements. It is apparent, however, that the government does not wish this to continue, even though that catch-up is the historical pattern.
The Impact on Wages: Wages have fallen behind not just inflation but also wages in other industries. The impact over the tenure of the current government has been quite marked.
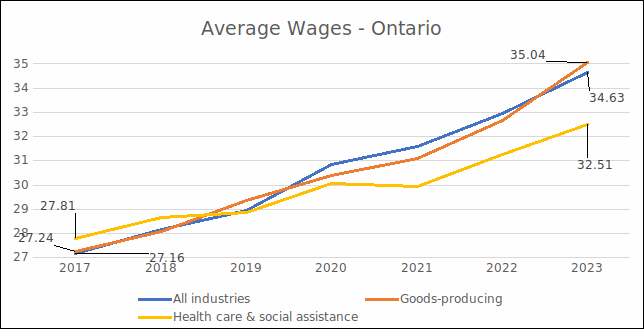
[Source: Statistics Canada: Table 14-10-0064-01 Employee wages by industry, annual www150.statcan.gc.ca]
The average hourly wage for employees in all industries in Ontario since 2017 until 2023 increased 27.5%. The average wage in goods-producing industries increased a little more: 28.6% over that same six-year period. In contrast, healthcare and social assistance workers saw a 16.9% increase.
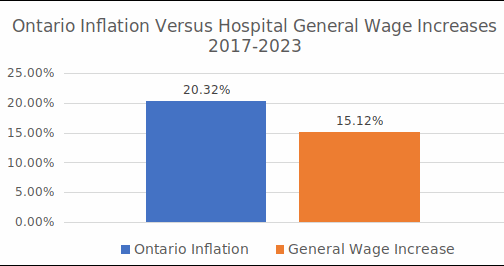
As a result, in 2017, the year before the current government was elected, healthcare and social assistance wages were 2.4% above the all-industry average. By 2023, healthcare and social assistance wages were 6.1% below the all-industry average. This is also almost exactly what happened to hospital worker wages.
The general wage increase for hospital service workers over this period was 15.1% compounded. The average wage increase over these six years reported by the hospitals for service workers is somewhat higher – a 17.35% wage increase ($25.75 to $30.22). This somewhat higher increase may well be accurate given wage adjustments for two major classifications (RPNs and PSWs) and the increasing role in hospitals of Registered Practical Nurses, who are near the top of the wage scale. Despite this, average hospital service wages are still more than ten percent lower than the all-industry wage increase.
The hospital service average wage went from 94.8% of the all-industry average to 87.3%. That is quite a change in the few short years since the current government was elected – over a 7% cut.
| Geography | Ontario | Current dollars | |||||
|---|---|---|---|---|---|---|---|
| Wages | Average hourly wage rate | ||||||
| Type of work | Both full- and part-time employees | ||||||
| Sex | Both sexes | ||||||
| Age group | 15 years and over | ||||||
| NAICS Industry | 2017 | 2018 | 2019 | 2020 | 2021 | 2022 | 2023 |
| All industries | 27.16 | 28.18 | 28.95 | 30.86 | 31.6 | 32.94 | 34.63 |
| Goods-producing | 27.24 | 28.09 | 29.36 | 30.41 | 31.11 | 32.65 | 35.04 |
| Services sector | 27.14 | 28.2 | 28.84 | 30.98 | 31.72 | 33.01 | 34.52 |
| Healthcare and social assistance | 27.81 | 28.68 | 28.85 | 30.06 | 29.96 | 31.25 | 32.51 |
| Hospital Service Worker Average | 25.75 | 27.69 | 30.22 | ||||
| Source: Statistics Canada: Table 14-10-0064-01 Employee wages by industry, annual www150.statcan.gc.ca. | |||||||
At the beginning of this period, just before the current government was elected, hospital service wages were $1.41 less than the all-industry average. They are now $4.41 behind the all-industry average – a loss of $3 an hour, or $5,850 annually for a full-time hospital service worker, over 80% of whom are women workers. Clearly, hospital work has become less attractive, and the women in these jobs have suffered a very significant loss in just a few years of this government’s rule.
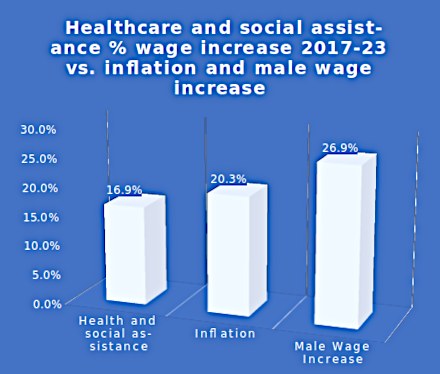
Inflation in Ontario between 2017 and 2023 was 20.3% (with the CPI increasing from 131.9 to 158.7). This means the average wage for healthcare and social assistance workers fell 3.4% behind inflation – losing more than half a percent per year on average. Meanwhile, average wages for men in all industries increased 10% more than health and social assistance wages.
Falling Real Wages for Hospital Workers and Staff Morale Crisis
As noted, general wage increases for hospital service workers since 2017 equal 15.1%. So, hospital workers that have not benefitted from a wage adjustment (the large majority) and who have not changed jobs, have seen their real wage fall 5.2% behind inflation over the six years from 2017 to 2023 – almost a percentage point per year.
Even if we use the average wage reported by the hospitals (which will also reflect wage adjustments for RPNs and PSWs and the change in the mix of staff), the average wage falls 2.97% behind inflation – a loss of about half a percent per year.
At the same time, the hospital industry has experienced a capacity crisis, short staffing, and the highest incidence of violence against staff of any industry. The result of these three factors is the morale crisis that OCHU-CUPE has illustrated through membership polls: 2 out of 5 hospital workers are considering quitting their job, and nearly 4 out of 5 say they are not confident in this government’s plan to improve the sector. Fully, 62% of workers polled said they were dealing with exhaustion and high stress levels, and 41% reported dreading going to work.
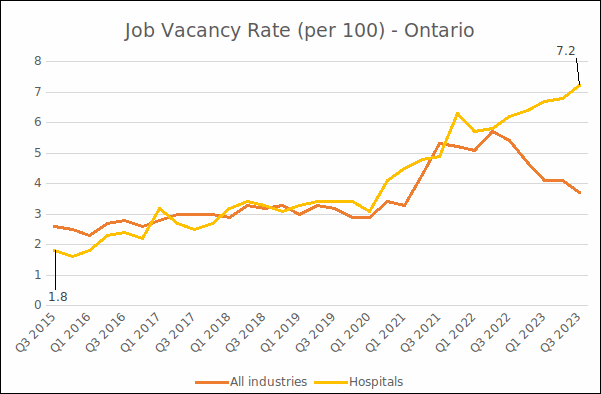
Offered Wages: There is also specific Statistics Canada data on the “average offered hourly wage” for hospital workers. “Average offered hourly wage” is the average of the wages offered for vacant positions. Again, all industries have seen much higher increases than the hospital sector. Hospital-offered wages were 60% above the all-industry average in Q3 2015, as is fitting for a sector that relies on skilled workers and has dense levels of unionization. But that fell to only 25% above by Q3 2023. Offered wages in the rest of the economy have increased much more quickly than they have in the hospital sector, and so it has become relatively less attractive to move into the hospital industry.
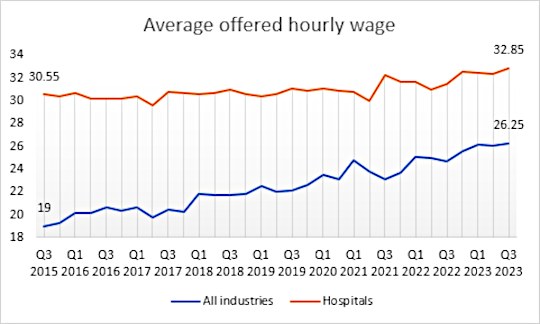
[Source: www150.statcan.gc.ca.]
It appears that the provincial government intends to deepen the gap between settlements for broader provincial public sector workers (like hospital workers) and other workers. Private sector annual average wage settlements negotiated in 2023 averaged 4.2%. While provincial broader public sector wage settlements improved dramatically in 2023 to 4.2%, it appears that government policy is to depress hospital settlements. If so, this will further exacerbate the problems in the hospital labour market, and the government will only have itself to blame.
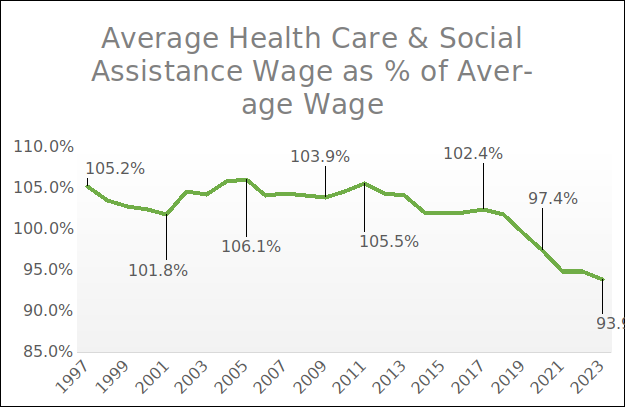
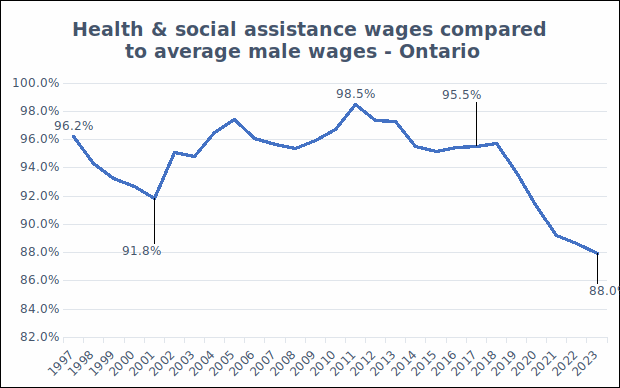
Women’s wages are being held back by the decline in healthcare, social assistance, and education wages.
The healthcare and social assistance average wage as a percentage of the all-industries average wage declined in the late 1990s during the Harris PC government, then had a modest recovery over 2002-2011, and then declined further, with an especially sharp decline since 2017. In just six years, healthcare and social assistance average wages fell from 102.4% of the all-industry average to 93.9% of the average.
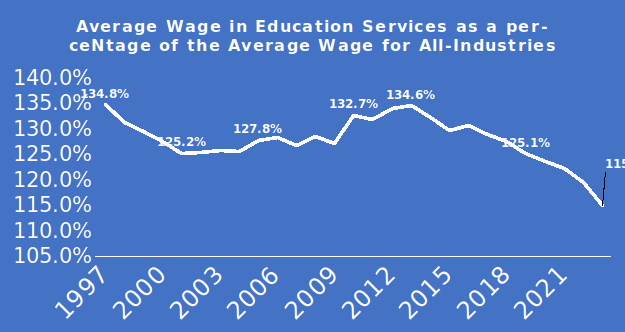
A similar trend also occurred in education.
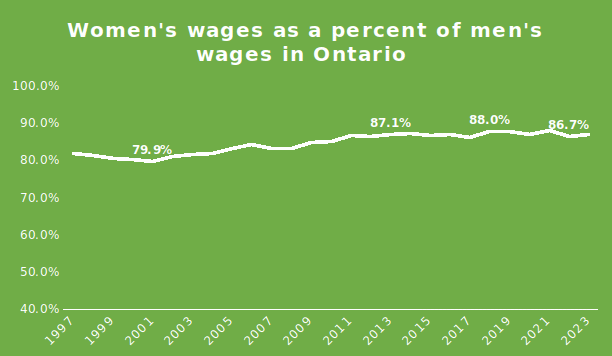
Similarly, women’s wages declined relative to men’s wages during the PC Harris government. After that, there was some progress (as public sector wages improved). But this levelled off in the second decade of this century (when broader public sector wages fell behind again). Women’s wages as a percentage of men’s wages have fallen since the election of the Ford government in 2018. Women’s wages were at 88% of men’s wages in 2018 but fell to 86.7% in 2022 and were at 87.2% in 2023.
Progress has been held back by the very sharp declines in real wages in the healthcare, social assistance, and education sectors, which account for almost a third of all women workers.
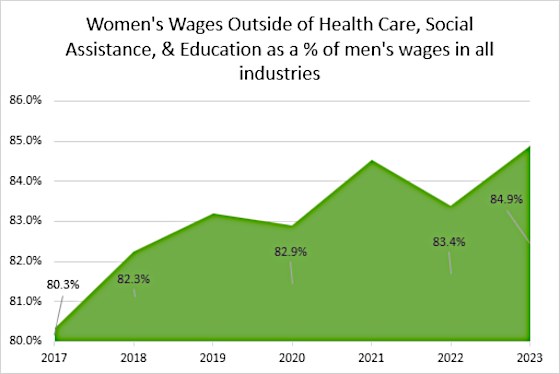
The good news is, despite the attack on women’s wage in these sectors during the Ford years, outside of these sectors women’s wages as a percentage of men’s wages have continued to increase.
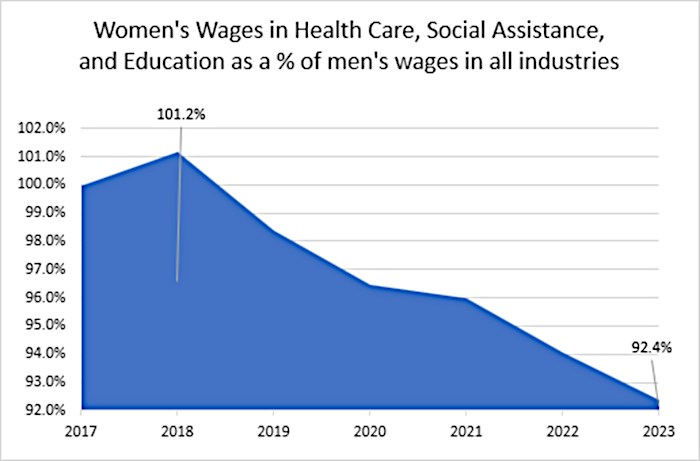
So, during the Harris years, health and social assistance wages fell relative to men’s wages in all industries. They improved after that until the second decade of this century when they began to decline again. After the Ford government was elected, health and social assistance wages fell sharply compared to men’s wages, stopping the increase in women’s wages relative to men.
Overwhelmingly, the negative trends in BPS wages have held back, or reversed, progress for women’s wages.
The price paid: The largely female BPS workforce has obviously paid a price. But the public is also paying a price for government wage austerity. There is a serious capacity crisis in healthcare.
Given this wage dynamic, it is not surprising that the hospital labour market is not like other industries. Vacancies keep going up. In 2015 vacancies were less than the all-industry rate. Now they are almost double the all-industry average.
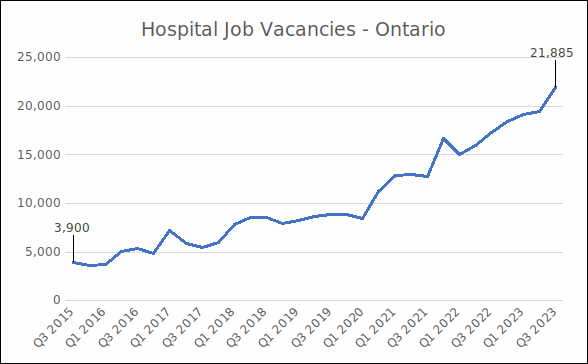
Hospital job vacancies keep increasing. They are now over three times what they were in 2015.
The result? Emergency Rooms close, over 100,000 patients wait longer than clinically indicated for their surgeries, there are no beds available in our hospitals, and legislation is passed to force patients out of hospitals. Hospital jobs just are not as attractive as they once were.
Conclusion
Public sector wage settlements have gone up and down over the last forty years. Typically, however, the periods when government has imposed wage suppression on the BPS have been followed by periods where BPS workers have done better.

In the last fourteen years, we have experienced an unusually long period during which government has suppressed BPS wages. Since the current government has been elected, wages in healthcare have fallen sharply. This has a very significant impact, holding back the wages of women workers.
In 2023, we began to see some relief from wage suppression – and with that a large portion of women workers in Ontario can hope to see some better opportunities. It is apparent, however, that the Ford government is not willing to play along with the historical pattern whereby periods of wage suppression are made up by periods of wage growth. This is especially serious, as BPS workers – mainly women workers – have seen an especially long period of wage suppression.
The Ford government has taken a special interest in portraying itself as a friend of private sector, blue collar workers, i.e., a group that is mostly male, and which is under threat due to de-industrialization and the province’s switch to the service and IT economies.
This makes for a lot of cosplay photo opportunities for the government and lots of money thrown at private corporations. But, for workers, the talk is cheap: the Ford government does not pay these private sector blue collar workers even one slim dime, and meanwhile, the government pursues an attack on its own BPS workforce – a policy that will tend to depress wages for both male and female workers throughout the economy. •
Endnotes
- Retail is the third biggest industry for women’s employment.
- The BPS also includes provincial crown employees such as the 66,000 employees in the provincial civil service – another large employer where the majority of employees are female. The BPS excludes the federal government and municipal governments.