Minimum wages have been getting a lot of attention lately. And for good reason. Workers earning minimum wage often struggle to get enough hours, don’t have predictable schedules or advance notice of shifts, and many don’t even have access to unpaid sick days.
 Alberta’s current government was elected on a plan to raise the minimum wage to $15 by 2018, and the Nova Scotia NDP recently tabled a bill that would have the minimum wage increase each January, eventually reaching $15 in 2019.
How many people even earn minimum wage? Well if you take everyone earning less than the primary minimum wage, there were 1,253,000 workers earning minimum wage or less in 2015 (many provinces have exceptions or lower wages for students or alcohol servers).
| Table 1 | Minimum wage (2015) |
Number (000s) |
Proportion of workers |
|---|---|---|---|
| Source: Labour Force Survey microdata 2015, Government of Canada Minimum wage database. | |||
| BC | $10.45 | 98.2 | 5.2% |
| AB | $11.20 | 100.1 | 5.2% |
| SK | $10.50 | 22.2 | 4.7% |
| MB | $11.00 | 50.4 | 9.1% |
| ON | $11.25 | 675.5 | 11.6% |
| QC | $10.55 | 232.6 | 6.6% |
| NB | $10.30 | 18.5 | 6.0% |
| NS | $10.60 | 30.9 | 7.9% |
| PEI | $10.75 | 6.6 | 10.6% |
| NFLD | $10.50 | 18.0 | 8.4% |
But if we’re talking about increasing the minimum wage, workers who earn just above that get a raise too. So how many workers benefit directly from a $15 minimum wage? Well, in 2015 about 25% of all workers in Canada made $15 / hr or less. That’s more than 4 million workers. This varies significantly by province, from 18% of all employees in Alberta, to 38% of all employees in PEI [see Table 2].
| Table 2 | Number (000s) |
Proportion of workers |
|
|---|---|---|---|
| BC | 482.5 | 25.5% | |
| AB | 350.5 | 18.2% | |
| SK | 106.6 | 22.7% | |
| MB | 162.8 | 29.6% | |
| ON | 1,670.1 | 28.6% | |
| QC | 971.4 | 27.5% | |
| NB | 111.5 | 36.0% | |
| NS | 130.6 | 33.5% | |
| PEI | 23.9 | 38.4% | |
| NFLD | 69.6 | 32.6% | |
| Source: Labour Force Survey microdata, 2015. | |||
We also often hear that low wage workers are young workers, living with their parents, and raising the minimum wage will only hurt them – making it harder for young workers to break into the labour market. David Green, a professor at UBC, reviewed the existing literature on minimum wages and found that “Estimated [employment] effects for young adult and adult workers range from insignificant to non-existent.” He also found the Canadian evidence shows that increasing the minimum wage reduces turnover – so raising the minimum wage actually creates more stable jobs for workers too.
And while lots of young workers are employed in low wage jobs, many adults are as well. Besides, young workers deserve a fair wage for their labour too.
Finally, women are disproportionately represented in these low wage jobs – fully one-third of women earn less than $15 / hr, compared to only 22% of men [see Table 3].
| Table 3 | Employees earning less than $15 (000s) | Low wage employees as % of all employees | ||
|---|---|---|---|---|
| Men | Women | Men | Women | |
| 15-24 | 776.5 | 892.0 | 65% | 74% |
| 25-54 | 681.1 | 1,112.9 | 13% | 22% |
| 55+ | 243.1 | 373.9 | 18% | 29% |
| Total | 1,700.7 | 2,378.8 | 22% | 32% |
| Source: Labour Force Survey microdata, 2015. | ||||
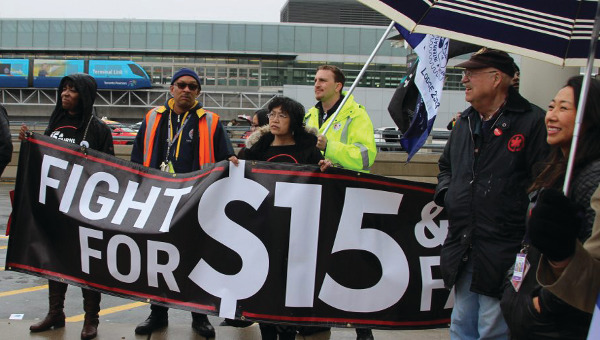
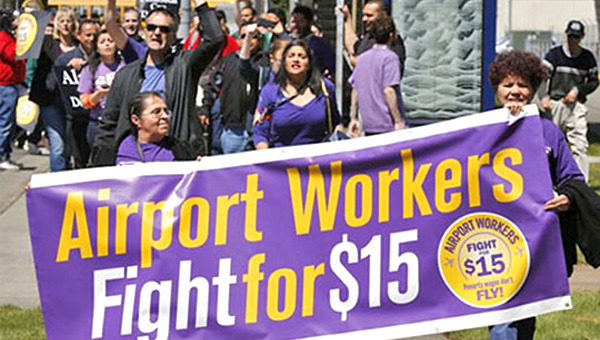
It’s also important to note that many in the Fight for $15 movement have made associated improvements in employment standards part of their campaign. In Ontario, the 15 and fairness campaign addresses issues such as sick days, predictable scheduling, and contract flipping.
Fight for $15 is a concrete way to push back against growing inequality and precarious work – join the fight for decent work in your province!
UPDATE: All numbers exclude self-employed workers. The Labour Force Survey doesn’t provide wage data for self-employed workers, and self-employed workers aren’t subject to minimum wage laws. “Proportion of workers” is more accurately “Proportion of employees.” The number of employees per province can be found in CANSIM Table 282-0012. •
This article first appeared at the Progressive Economics Forum.


